Statistics
- statistics is about understanding the role that variability plays in drawing conclusions based on data : 统计是关于理解可变性在基于数据得出结论中的作用
- 这种应用之所以称为描述性的,是因为它只是对数据的一种"总结",它只涉及现有数据,不超出其外,用统计的语言说,它并不企图对数据(X1,Y1),...,(Xn,Yn)所来自的总体作任何推断。
- descriptive statistics 叙述统计学 / inferential/inductive statistics 推论/归纳统计学
- Statistics is the scientific discipline that provides methods to help us make sense of data <统计学是一门科学学科,它提供帮助我们理解数据的方法>
- Emphasize statistical literacy and develop statistical thinking. <重视统计素养,培养统计思维。>
- a simpler introduction to the least-squares criterion <最小二乘准则的简单介绍>
- regression equation, the sums of squares and coefficient of determination, and the linear correlation coefficient --- 回归方程、平方和和和确定系数以及线性相关系数
- Density Curves --- 密度曲线 / introductory Focusing on Data Analysis --- 数据分析导论
- The Sampling Distribution of the Sample Mean --- 样本均值的抽样分布
- confidence intervals for one population mean --- 一个总体均值的置信区间
- hypothesis tests for one population mean --- 一个总体均值的假设检验
- Descriptive statistics includes the construction of graphs, charts, and tables and the calculation of various descriptive measures such as averages, measures of variation, and percentiles --- 描述性统计包括图形、图表和表格的构造,以及各种描述性度量的计算,如平均值、变异度量和百分位数; If the purpose of the study is to examine and explore information for its own intrinsic interest only, the study is descriptive --- 如果研究的目的仅仅是为了自身的内在利益而检查和探索信息,那么研究就是描述性的
- To obtain information about a subject of interest, plan and conduct a study --- 获取感兴趣的主题的信息,计划并进行研究
- probability sampling --- 概率抽样
- simple random sampling with replacement (SRSWR) <带替换的简单随机抽样(SRSWR)> / simple random sampling without replacement (SRS) <无替换简单随机抽样(SRS)>
- Systematic Random Sampling<系统随机抽样>:
- Cluster Sampling 聚类抽样;分群抽样;聚类采样;Ideally, each cluster should mirror the entire population --- 理想情况下,每个集群应该反映整个总体
- In a randomized block design, the experimental units are assigned randomly among all the treatments separately within each block. --- 在随机块设计中,随机分配实验单元 在每个块内分别处理。
Chapter 2 Organizing Data
- A characteristic that varies from one person or thing to another is called a variable --- 因人或事物而异的特征称为变量
- A discrete variable is a variable whose possible values can be listed, even though the list may continue indefinitely --- 离散变量是可以列出其可能值的变量,即使列表可能会无限期地继续
- A continuous variable is a variable whose possible values form some interval of numbers. --- 连续变量是一个变量,其可能的值构成一些数字间隔。
- Each individual piece of data is called an observation, and the collection of all observations for a particular variable is called a data set --- 每一个单独的数据被称为一个观测值,而一个特定变量的所有观测值的集合被称为一个数据集
- Ordinal Data : 序号数据
- **What is a frequency distribution of qualitative data and why is it useful? A frequency distribution of qualitative data is a listing of the distinct values and their frequencies**. A frequency distribution is useful for organizing qualitative data so the data are more compact and easier to understand.
- The distribution of a data set is a table, graph, or formula that provides the values of the observations and how often they occur. --- 数据集的分布是一个表、图形或公式,用于提供观测值及其发生频率。
- To identify the shape of a distribution, the best approach usually is to use a smooth curve that approximates the overall shape --- 要确定分布的形状,通常最好使用近似整体形状的平滑曲线
- Three important general aspects of the shape of a distribution involve modality, symmetry, and skewness -- 分布形状的三个重要方面涉及形态、对称性和偏斜性
- distributions with pronounced but not necessarily equal height peaks are often called bimodal or multimodal --- 具有明显但不一定等高峰值的分布通常称为双峰或多峰
Chapter 3 Descriptive measures描述性度量
- Another method of summarizing data is to compute numbers, such as averages and percentiles, that describe the data set. --- 汇总数据的另一种方法是计算描述数据集的数字,如平均数和百分位数。
- measures of variation : 变异量数
- To describe that difference quantitatively, we use a descriptive measure that indicates the amount of variation, or spread, in a data set. Such descriptive measures are referred to as measures of variation or measures of spread 为了定量地描述这种差异,我们使用一种描述性的度量方法来表示数据集中的变化量或扩散量。这种描述性测量被称为变异度量或扩散度量
- The range(级差) of a data set is the difference between the **maximum (largest) and minimum (smallest) observation**s
- Variation and the Standard Deviation: The more variation that there is in a data set, the larger is its standard deviation. <it is not resistant: its value can be strongly affected by a few extreme observations>
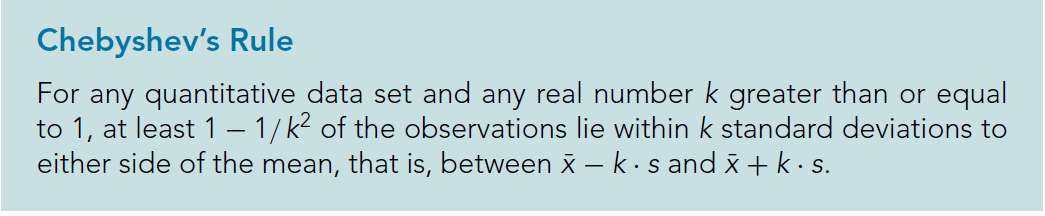
- Three-Standard-Deviations Rule (三个标准差规则) : Almost all the oberservations in any data set lie within three standard deviations to either side of the mean
- 切比雪夫定理(Chebyshev's theorem)与经验法则(Empirical Rule):
- For
- For
- The quartiles divide a data set into quarters (four equal parts). 四分位数将数据集分成四分之一(四等分)。
- A standardized variable(标准化变量: 数学期望为0和方差等于1的随机变量) always has mean 0 and standard deviation 1. For this and other reasons, standardized variables play an important role in many aspects of statistical
theory and practice;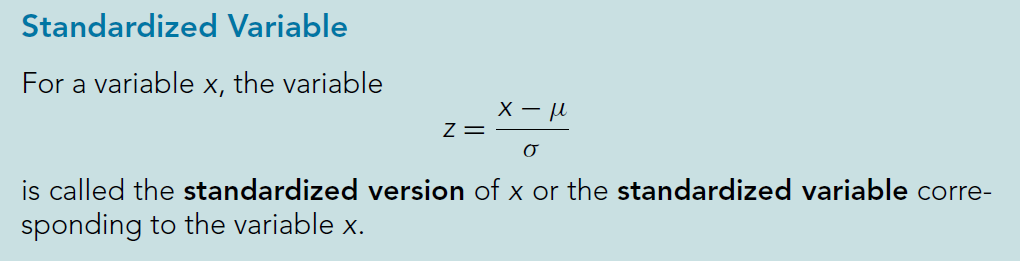
Chapter 4 Probability Concepts
- Another important aspect of this text is to present the fundamentals of inferential statistics—methods of drawing conclusions about a population based on information from a sample of the population --- 本文的另一个重要方面是介绍推断统计的基本原理,即根据总体样本中的信息得出关于总体的结论的方法
- Sample Space and Event
- Sample Space : The collection of all possible outcomes for an experiment.
- More precisely, an event is a collection of outcomes --- 更确切地说,事件是结果的集合, that is, any subset of the sample space. An event occurs if and only if the outcome of the experiment is a member of the event.
- Complementation Rule : 互补规则;
- Data from one variable of a population are called univariate data --- 来自总体一个变量的数据称为单变量数据; Data from two variables of a population are called bivariate data, and a frequency distribution for bivariate data is called a contingency table or two-way table --- 来自总体的两个变量的数据称为双变量数据,双变量数据的频率分布称为列联表或双向表
- Joint and Marginal Probabilities : 联合概率和边缘概率
- **The General Multiplication Rule : If A and B are any two events, then P(A & B) = P(A) · P(B | A)**.
- Independent Events : Event B is said to be independent of event A if P(B | A) = P(B).
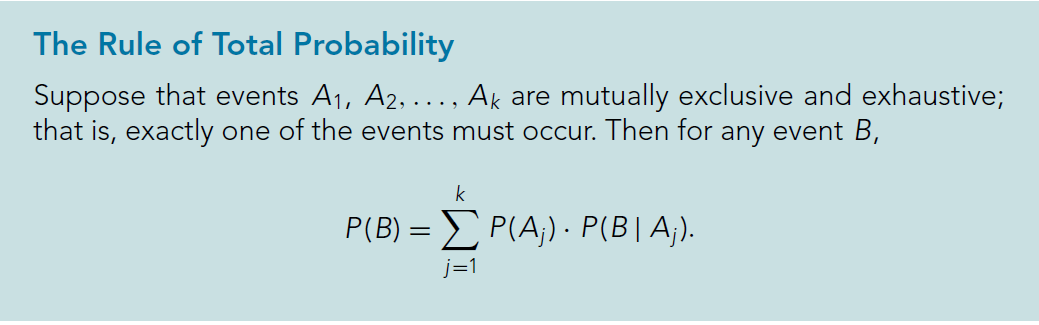
- The Rule of Total Probability (全概率法则)
Chapter 5 Discrete Random Variables
- 随机变量是指变量的值无法预先确定仅以一定的可能性(概率)取值的量。随机变量 (random variable)的本质是一个函数,是从样本空间的子集到实数的映射,将事件转换成一个数值。
- Interpretation of the Mean of a Random Variable : In a large number of independent observations of a random variable X, the average value of those observations will approximately equal the mean (expectation), μ, of X. The larger the number of observations, the closer the average tends to be to μ.
- Bernoulli Trials (伯努利试验): 伯努利试验是在同样的条件下重复地、各次之间相互独立地进行的一种试验。一般地,在相同条件下重复做n次的试验称为n次独立重复试验。1. “在相同条件下”等价于各次试验的结果不会受其他实验结果的影响。2.如何判断:判断是否为伯努利试验的关键是每次试验事件A的概率不变,并且每次试验的结果同其他各次试验的结果无关,重复是指试验为一系列的试验,并非一次试验,而是多次,但要注意重复事件发生的概率相互之间没有影响。
- Binomial Approximation to the Hypergeometric Distribution : 超几何分布的二项式逼近
Chapter 6 The Normal Distribution
- Areas under the Standard Normal Curve --- 标准正态曲线下的区域;Assessing Normality; Normal Probability Plots --- 评估正态性;正态概率图
- A normal distribution (and hence a normal curve) is completely determined by the mean and standard deviation; that is, two normally distributed variables having the same mean and standard deviation must have the same distribution
- Sampling error is the error resulting from using a sample to estimate a population characteristic.
- The distribution of a statistic (i.e., of all possible observations of the statistic for samples of a given size) is called the sampling distribution of the statistic --- 一个统计量的分布(即给定大小的样本的统计量的所有可能观测值的分布)称为统计量的抽样分布
- we can often approximate that sampling distribution by a normal distribution --- 我们通常可以用正态分布来近似抽样分布
- The Central Limit Theorem (CLT) : For a relatively large sample size, the variable x¯ is approximately normally distributed, regardless of the distribution of the variable under consideration. The approximation becomes better with increasing sample size
- 正态概率图(normal probability plot) -- 6.4
Chapter 8 Confidence Intervals for One Population Mean
- A point estimate of a parameter is the value of a statistic used to estimate the parameter --- 参数的点估计是用于估计参数的统计值
- unbiased estimator 无偏估计 : More generally, a statistic is called an unbiased estimator of a parameter if the mean of all its possible values equals the parameter; otherwise, the statistic is called a biased estimator of the parameter.
- Margin of Error : 误差幅度 **which indicates **the accuracy of our guess (point estimate) for the value of the unknown parameter under consideration.
Decreasing the confidence level decreases the margin of error
- Confidence and Accuracy: For a fixed sample size, decreasing the confidence level decreases the margin of error and, hence, improves the accuracy of a confidence-interval estimate
- Sample Size and Accuracy : For a fixed confidence level, increasing the sample size decreases the margin of error and, hence, improves the accuracy of a confidence-interval estimate
- We identify a particular t-distribution by its number of degrees of freedom (df ) --- 我们按自由度 (df ) 的数量来识别特定的 t 分布; 在概率论和统计学中,t-分布(t-distribution)用于根据小样本来估计呈正态分布且方差未知的总体的均值。如果总体方差已知(例如在样本数量足够多时),则应该用正态分布来估计总体均值
- Test Statistic(检验统计量)
The chi-square test(卡方检验)
Chapter 9 Hypothesis Tests for One Population Mean
- Critical-Value Approach to Hypothesis Testing : 假设检验的临界值方法 / P-Value Approach to Hypothesis Testing: 假设检验的P值方法
Hypothesis Tests for One Population Mean When σ Is Known : 已知σ时一个总体均值的假设检验
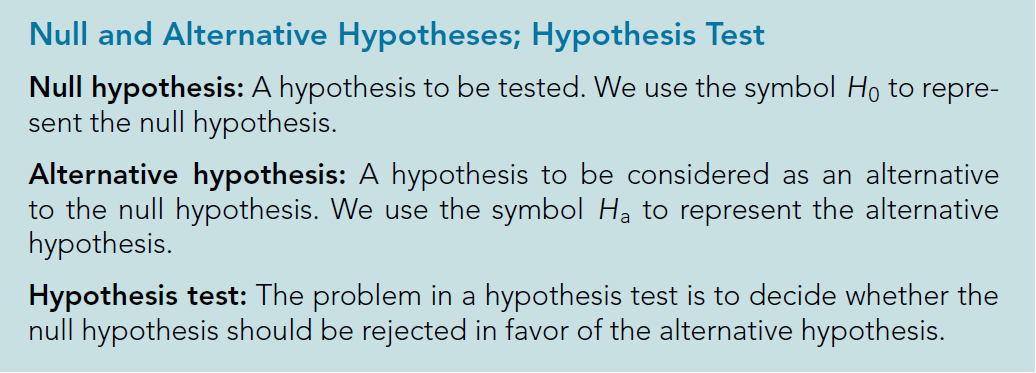
Wilcoxon Signed-Rank Test : Wilcoxon 有符号秩检验/ null hypothesis: 零假设/原假设: 基于一种假设的系统模型,在这种假设下我们认为观测到的效应是有偶然因素造成的,即不是统计上显著的(statistically significant).
significance level of the hypothesis test (假设检验的显著性水平): The probability of making a Type I error, that is, of rejecting a true null hypothesis, is called the significance level, α, of a hypothesis test.
The criterion for deciding whether to reject the null hypothesis involves a comparison of the value of the test statistic to the cutoff point(s) : 决定是否拒绝零假设的标准涉及将检验统计值与截止点进行比较
The P-value of a hypothesis test is the probability of getting sample data at least as inconsistent with the null hypothesis (and supportive of the alternative hypothesis) as the sample data actually obtained : 假设检验的P值是获得样本数据的概率,至少与实际获得的样本数据不一致(并且支持替代假设);The smaller (closer to 0) the P-value, the stronger is the evidence against the null
hypothesis and, hence, in favor of the alternative hypothesis.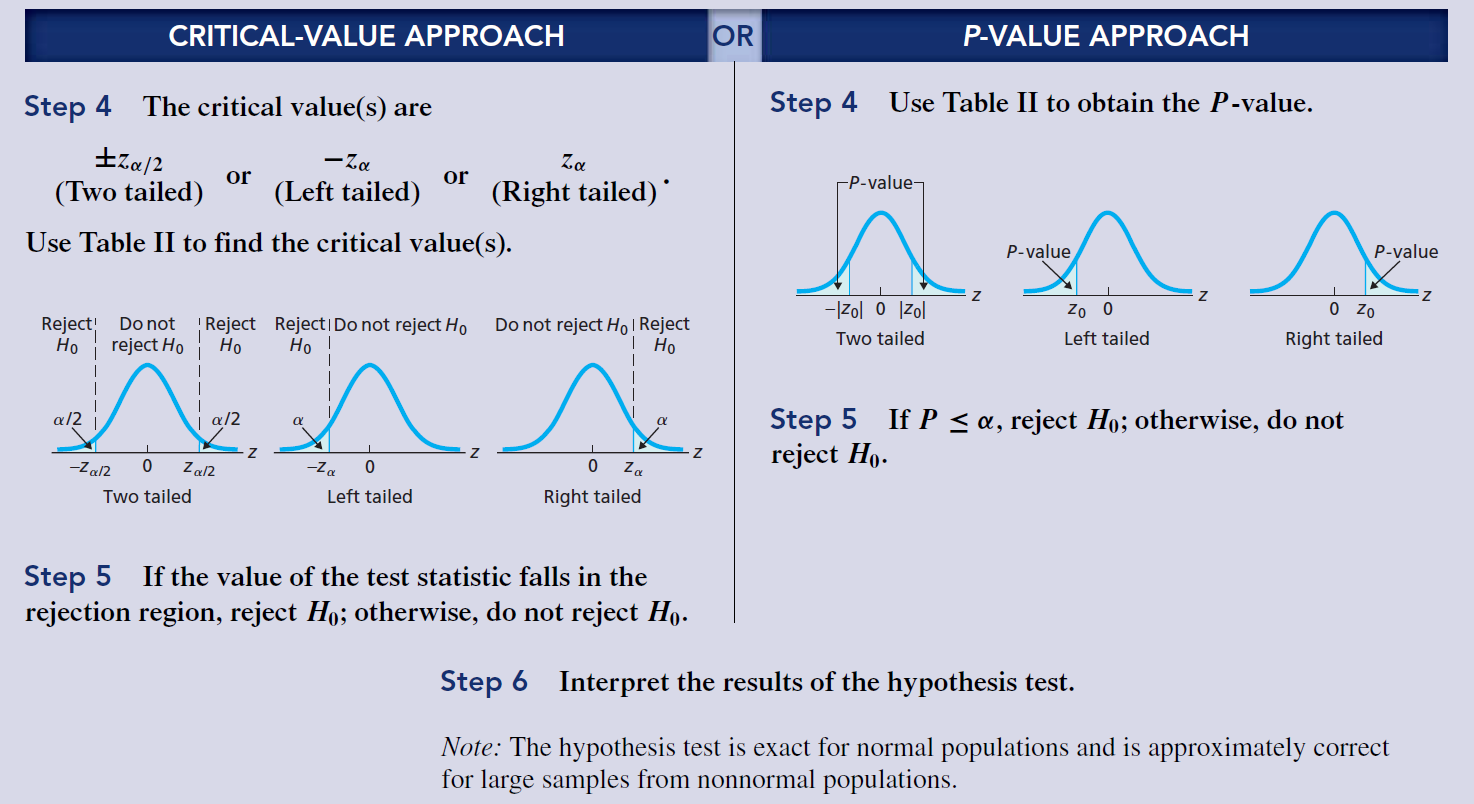
common statistical practice is to refer to most methods that can be applied without assuming normality as nonparametric ---通常的统计实践是指大多数方法,这些方法可以在不假设正态性为非参数的情况下应用。
power即功效,是备择假设正确时,结论为接受备择假设的概率,即1-第二类错误的概率。 size即sample size,就是样本量。样本量越大当然功效越大了。
Chapter 10 Inferences for Two Population Mean
- we examine two types of inferential procedures for comparing the means of two populations. --- 我们研究了两种用于比较两个总体均值的推理程序
- The Sampling Distribution of the Difference between Two Sample Means for Independent Samples --- 独立样本两样本均值差的抽样分布
- pooled sample standard deviation : 合并样本标准差
- Distributions of the Same Shape : We say that two or more distributions have the same shape if they are identical except possibly for the locations of their centers
- A population proportion is the proportion (percentage) of a population that has a specified attribute --- 总体比例是具有指定属性的人口的比例(百分比)
- Chi-Square Goodness-of-Fit Test : 卡方拟合度检验/拟合度检验是对已制作好的预测模型进行检验,比较它们的预测结果与实际发生情况的吻合程度。通常是对数个预测模型同时进行检验,选其拟合度较好的进行试用。
- Chance Experiments and Events : 偶然的实验和事件
- We need to calculate a number that measures the goodness of fit --- 我们需要计算一个衡量拟合优度的数字
- Grouping bivariate data into a contingency table by hand : 手工将二元数据分组到列联表中
- Roughly speaking, two variables of a population are associated if knowing the value of one of the variables imparts information about the value of the other variable. --- 粗略地说,如果知道其中一个变量的值会传递关于另一个变量值的信息,那么总体中的两个变量是相关联的。
- Two associated variables are also called statistically dependent variables --- 两个相关变量也称为统计因变量
Chapter 14 Descriptive Methods in Regression and Correlation
- The slope of a line measures its steepness : 线的斜率测量其陡度
- independent variable : 自变量; dependent variable: 因变量;regression equation: 回归方程
- linear equations with one independent variable : 一个独立变量的线性方程
- the Least-Squares Criterion: 最小二乘准则(The least-squares criterion is that the line that best fits a set of data points is the one having the smallest possible sum of squared errors.)
- We want to fit a line to the data points : 我们希望将一条线与数据点拟合
- 协方差(Covariance)在概率论和统计学中用于衡量两个变量的总体误差。而方差是协方差的一种特殊情况,即当两个变量是相同的情况。
- the Coefficient of Determination : 决定系数
- Pearson product moment correlation coefficient : 皮尔逊积矩相关系数
- analysis of variance or ANOVA : 方差分析
- This type of ANOVA is called one-way analysis of variance because it compares the means of a variable for populations that result from a classification by one other variable, called the factor : 这种类型的ANOVA被称为方差单向分析,因为它通过另一个变量(称为因子)将分类所得的总体变量的均值进行比较。
- If the variation among the sample means is large relative to the variation within the samples, conclude that the means of the populations are not all equal --- 如果样本均值之间的差异相对于样本内的差异较大,则可以得出总体均值不完全相等的结论
- This book brings the mathematical foundations of basic machine learning concepts to the fore : 本书突显了基础机器学习概念的数学基础
- Machine learning builds upon the language of mathematics to express concepts that seem intuitively obvious but that are surprisingly difficult to formalize. Once formalized properly, we can gain insights into the task we want to solve : 机器学习建立在数学语言的基础上,用以表达看起来直观上显而易见但难以形式化的概念。 正确形式化后,我们可以洞悉要解决的任务